MATLAB is a powerful computing environment and programming language widely used for mathematical computations, simulations, and graphics.
One common requirement when creating plots or graphical representations is to adjust the font size for better visibility and aesthetics. This guide provides a step-by-step approach to how to increase font size in MATLAB, focusing on various plot components.
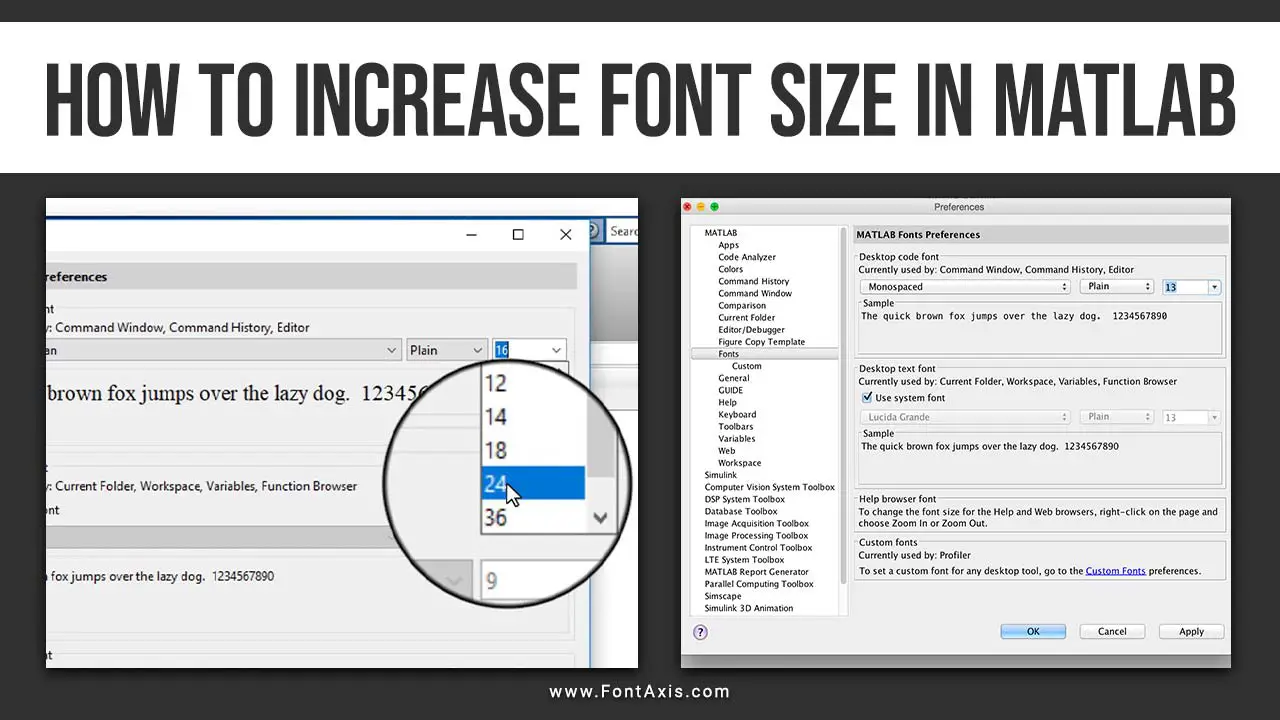
Increase Font Size In MATLAB
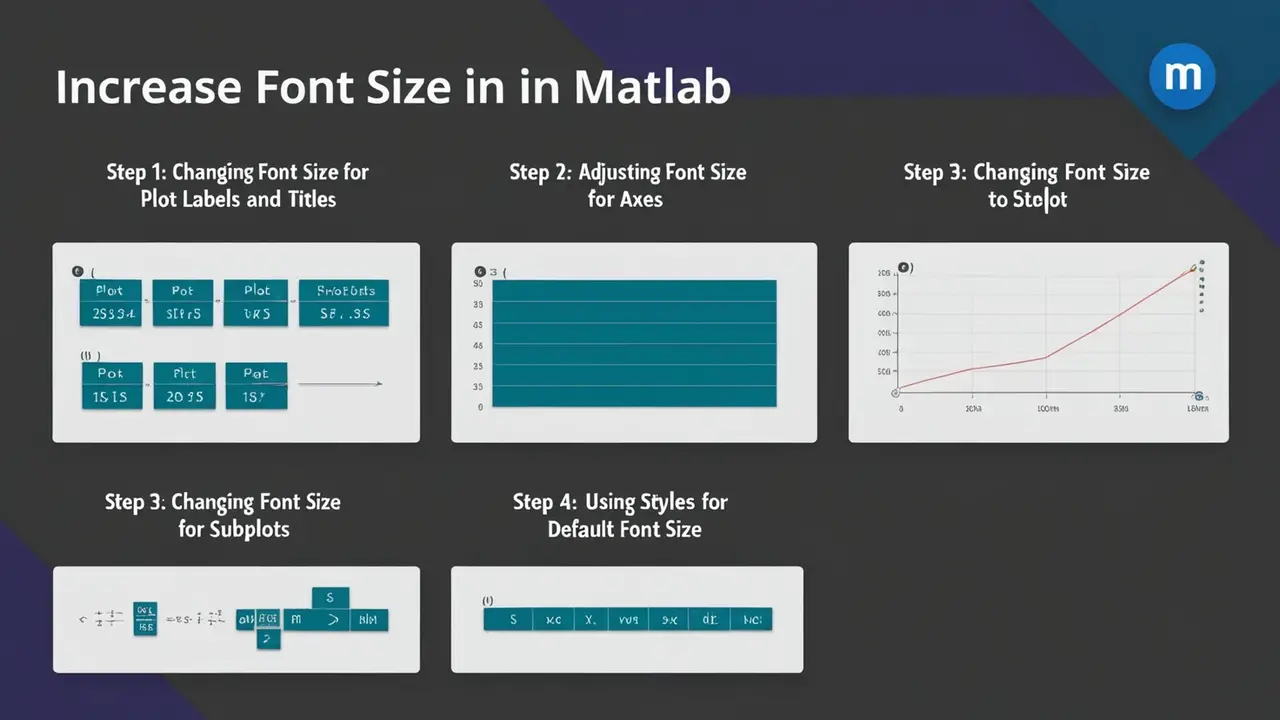
In MATLAB, the font size can be modified for various graphical objects, including labels, titles, and axes. The default font size may not always suit your design needs, especially when preparing content for presentations, blogs, or publications. Adjusting font sizes ensures that your graphics are clear and accessible, particularly in communication and educational contexts.
Step 1: Changing Font Size For Plot Labels And Titles
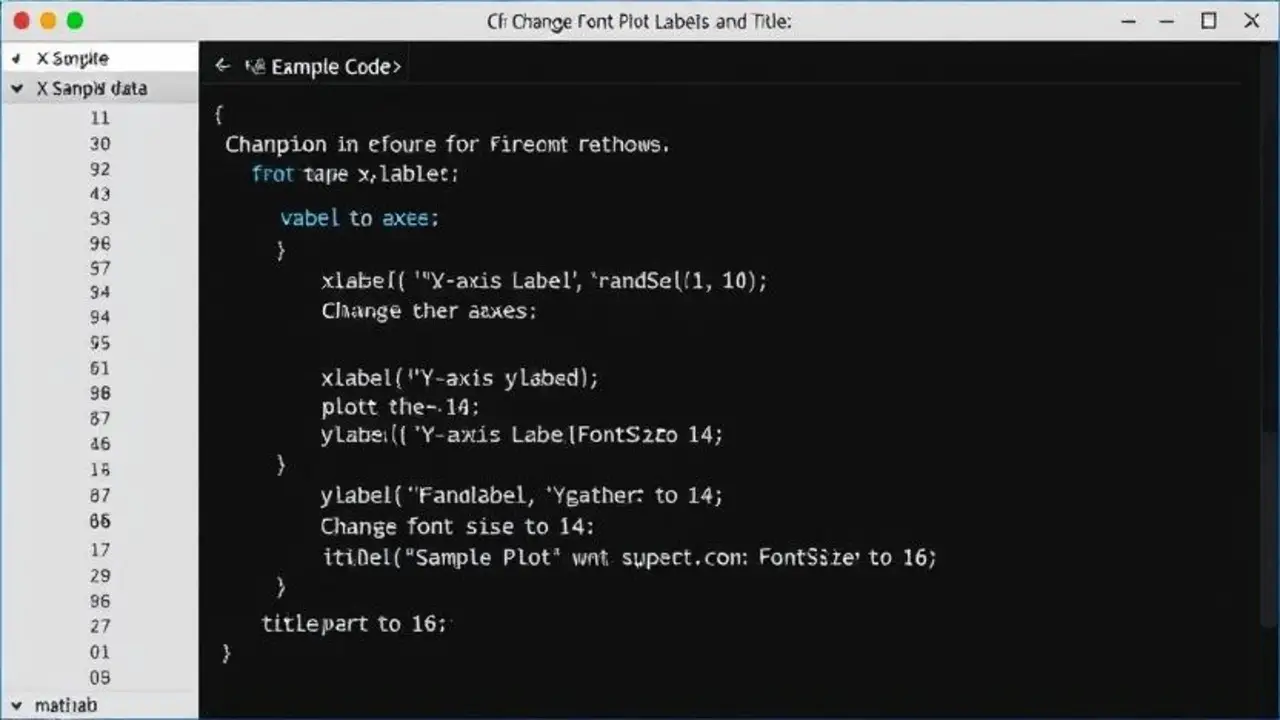
To begin, let’s look at how to change the font size for basic plot components such as the xlabel, ylabel, and title.
Example Code:
matlab
% Sample data

x = 1:10;

y = rand(1, 10);
% Create a plot

figure;

plot(x, y);
% Label the axes
xlabel(‘X-Axis Label’, ‘FontSize’, 14); % Change font size to 14
ylabel(‘Y-Axis Label’, ‘FontSize’, 14); % Change font size to 14
title(‘Sample Plot’, ‘FontSize’, 16); % Change font size to 16
In this example, we specify the FontSize property directly in the xlabel, ylabel, and title commands, increasing the font size to enhance visibility.
Step 2: Adjusting Font Size For Axes
In addition to changing the font size of labels and titles, you can also modify the font size for axis ticks and other properties of the axes.
Example Code:
matlab
% Create a plot
figure;
plot(x, y);
% Set axis properties
ax = gca; % Get current axes
ax.XAxis.FontSize = 12; % Change font size for x-axis ticks
ax.YAxis.FontSize = 12; % Change font size for y-axis ticks
% Add labels
xlabel(‘X-Axis’, ‘FontSize’, 14);
ylabel(‘Y-Axis’, ‘FontSize’, 14);
title(‘Customized Axes Font Size’, ‘FontSize’, 16);
Here, gca is used to get the current axis object, allowing us to modify properties like FontSize for both the x-axis and y-axis.
Step 3: Changing Font Size For Subplots
When dealing with multiple plots in a single figure using subplots, you might want to ensure that each subplot maintains consistent font sizing. This can be achieved by applying the same font size settings across all subplots.
Example Code:
Matlab
% Create subplots

figure;

subplot(2, 1, 1);  % First subplot

plot(x, y);

xlabel('First Subplot X', 'FontSize', 12);

ylabel('First Subplot Y', 'FontSize', 12);

title('First Subplot', 'FontSize', 14);
subplot(2, 1, 2); % Second subplot
plot(y, x);
xlabel(‘Second Subplot X’, ‘FontSize’, 12);
ylabel(‘Second Subplot Y’, ‘FontSize’, 12);
title(‘Second Subplot’, ‘FontSize’, 14);
This example demonstrates how to change the font size for multiple subplots effectively, ensuring a consistent appearance.
Step 4: Using Styles For Default Font Size
If you often work with certain font sizes and styles, you can create a custom function or script to set the default font size for all your plots. This approach can save time and ensure uniformity across various graphics.
Example Code:
matlab
function setPlotFontSize(fontSize)

ax = gca;  % Get current axes

ax.XAxis.FontSize = fontSize;

ax.YAxis.FontSize = fontSize;

xlabel('X-Axis', 'FontSize', fontSize);

ylabel('Y-Axis', 'FontSize', fontSize);

title('Default Font Size Set', 'FontSize', fontSize);

end
You can call this function with your desired font size:
Matlab
figure;

plot(x, y);

setPlotFontSize(14);  % Set font size to 14 for all elements
Step 5: Changing Font Size For Other Graphics Objects
MATLAB also allows you to change the font size for various other graphics objects, such as legends and annotations. Here’s how you can do that:
Example Code For Legend:
Matlab
% Create a plot

figure;

plot(x, y, 'DisplayName', 'Random Data');

hold on;

plot(x, rand(1, 10), 'DisplayName', 'More Data');
% Create a legend
legend(‘show’, ‘FontSize’, 12); % Change font size for the legend
Example Code For Annotations:
Matlab
% Create a plot

figure;

plot(x, y);
% Add an annotation
annotation(‘textbox’, [0.5, 0.5, 0.1, 0.1], ‘String’, ‘Middle of Plot’, …
‘FontSize’, 14, ‘FitBoxToText’, ‘on’);
Conclusion
Increasing font size in MATLAB is a crucial aspect of creating clear and effective graphical presentations. By adjusting the font size for labels, titles, axes, legends, and annotations, you can significantly enhance the readability of your plots. This guide covered various methods to modify font sizes, ensuring that your graphics are not only functional but also aesthetically pleasing.
FAQs
1.How Can I Set A Default Font Size For All Plots In MATLAB?
You can create a custom function to set the default font size for all plot elements or modify the gca properties.
2.Can I Change The Font Size Of A Specific Plot Without Affecting Others?
Yes, by setting the properties of the specific axes or plot commands individually.
3.Is It Possible To Change Font Sizes For Subplots In MATLAB?
Absolutely! You can adjust font sizes for each subplot by applying the font size settings separately.
4.How Do I Change The Font Size For Legends In MATLAB?
You can specify the FontSize property in the legend command.
5.What If My Font Size Changes Do Not Appear In The Exported Graphics?
Ensure you are using the correct rendering settings, and check your graphics export settings for font size configurations.

