Gnuplot is a powerful plotting tool used across fields like data science, physics, and engineering to generate professional and highly customizable plots. With Gnuplot, you can control nearly every detail of your plots, from font size to axis labels and plot styles.
This guide provides a step-by-step walkthrough for customizing font sizes in Gnuplot using various commands and terminal types, ensuring that your graphs are both readable and visually appealing.
Step 1: Setting Up Basic Plot Commands In Gnuplot

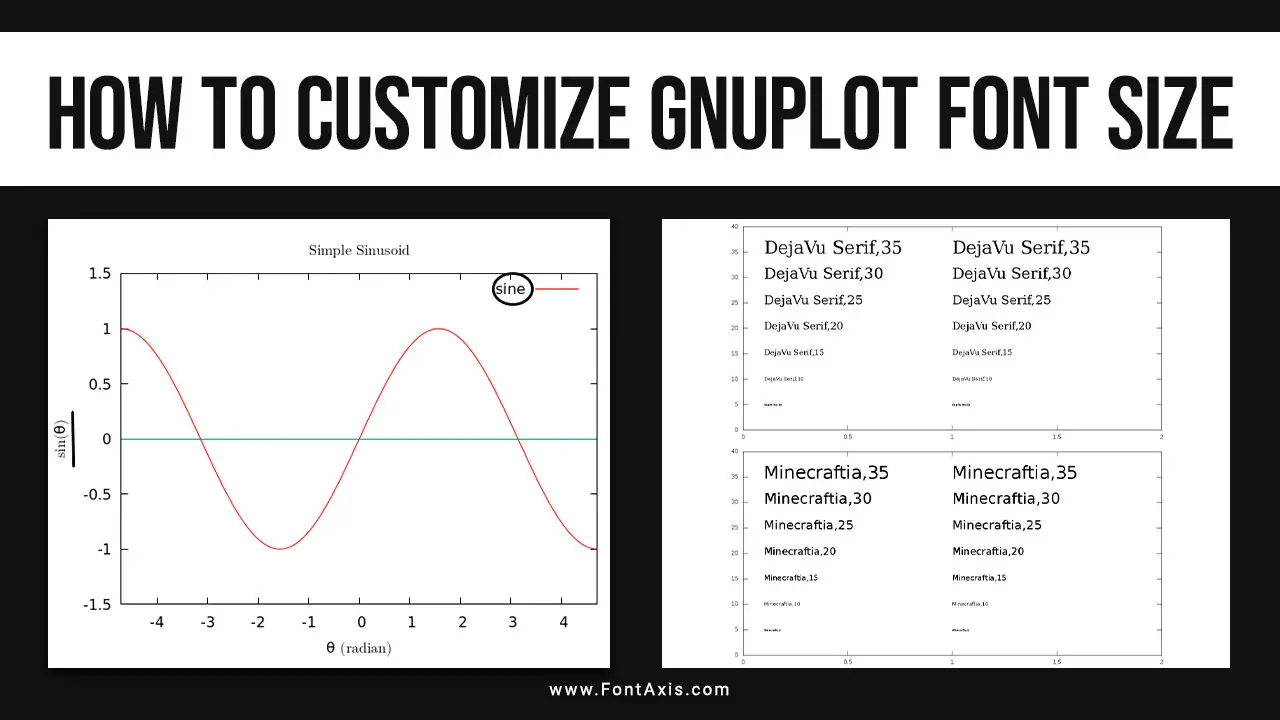
Before customizing fonts, start with a basic plot command:
gnuplot plot sin(x)
This creates a simple graph of the sine function, which we can now enhance by adjusting font sizes, axis labels, and more.
Step 2: Customizing Font Size For Plot Titles And Labels
To add titles and labels with customized font sizes, use the set title, set xlabel, and set ylabel commands. The syntax for these commands includes the font argument, where you can specify the desired font size:
gnuplot set title “Sine Wave Graph” font “,20” set xlabel “X-axis” font “,14” set ylabel “Y-axis” font “,14” plot sin(x)
In the example above, the title font size is 20, and the x-axis and y-axis labels are 14. Adjust these values to find the best fit for your plot.
Step 3: Customizing Tick Labels With Set Format
The set format command customizes the tick labels along the x-axis, y-axis, and z-axis in a 3D plot. Here’s how you can set the font size for tick labels:
gnuplot set format x “%4.1f” font “,10” set format y “%4.1f” font “,10”
This command sets the format and font size for both axes to 10. This can make your tick labels more readable without overwhelming the plot area.
Step 4: Adjusting Font Size With Terminal Types
The terminal type you use in Gnuplot determines how the font is rendered. Here are some commonly used terminals for font customization:
Using The EPSLATEX Terminal
The eps-latex terminal allows for LaTeX integration and supports enhanced text mode, where you can apply LaTeX commands within plot labels:
gnuplot set terminal epslatex size 5,3 font “,12” set output “output.tex” plot sin(x)
With this setup, Gnuplot exports the plot as a LaTeX-compatible file, where you can further adjust font sizes.
Using The PostScript Terminal
For high-quality graphics, the postscript terminal is ideal, as it allows precise control over specified font sizes:
gnuplot set terminal postscript font “Helvetica,16”
This command sets the font to Helvetica at size 16, which is useful for creating publication-ready plots.
Other Terminals (PNG, SVG)
For on-screen or web graphics, png and svg terminals are popular. You can specify font size in these formats as well:
gnuplot set terminal png font “Arial,14” set output “plot.png” plot sin(x)
Step 5: Scaling The Entire Plot With Set Size
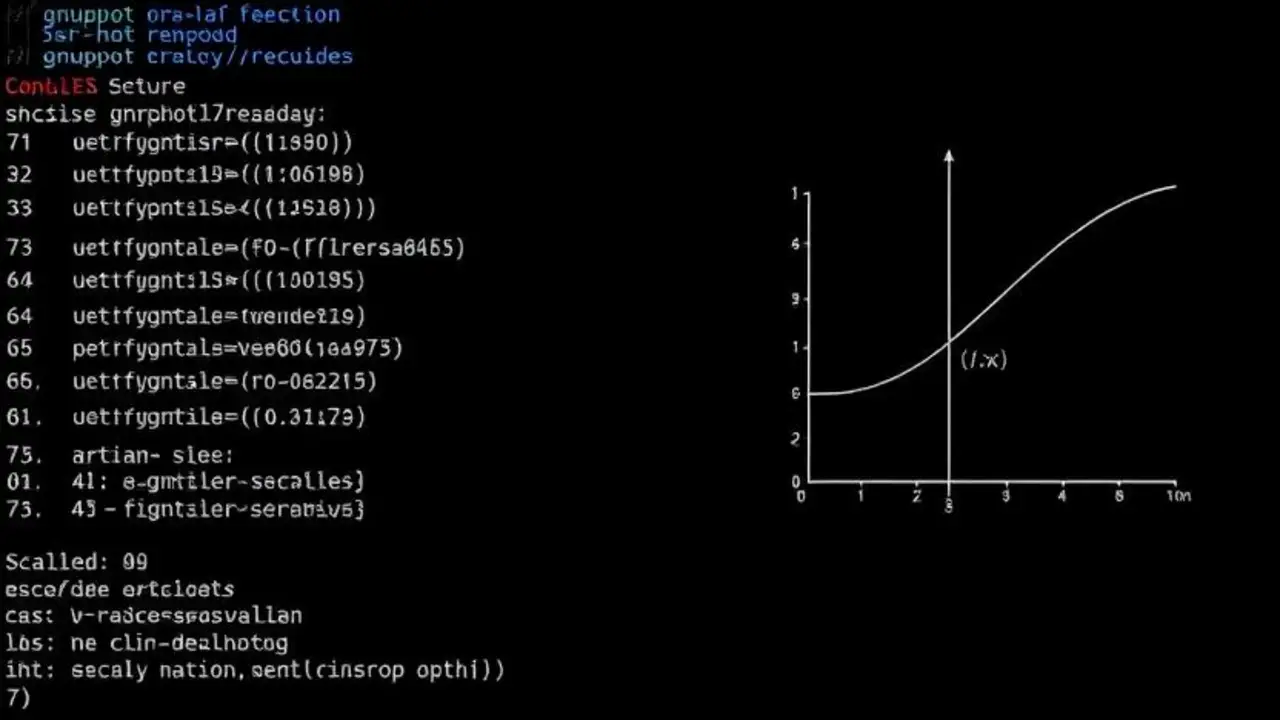
To ensure that fonts and other elements remain proportionate, use the set size command to scale the plot dimensions:
gnuplot set size 1.2, 1.2 plot sin(x)
This command scales the plot’s aspect ratio, ensuring that font sizes appear balanced without stretching or distorting the plot elements.
Step 6: Labeling Specific Points With Set Label
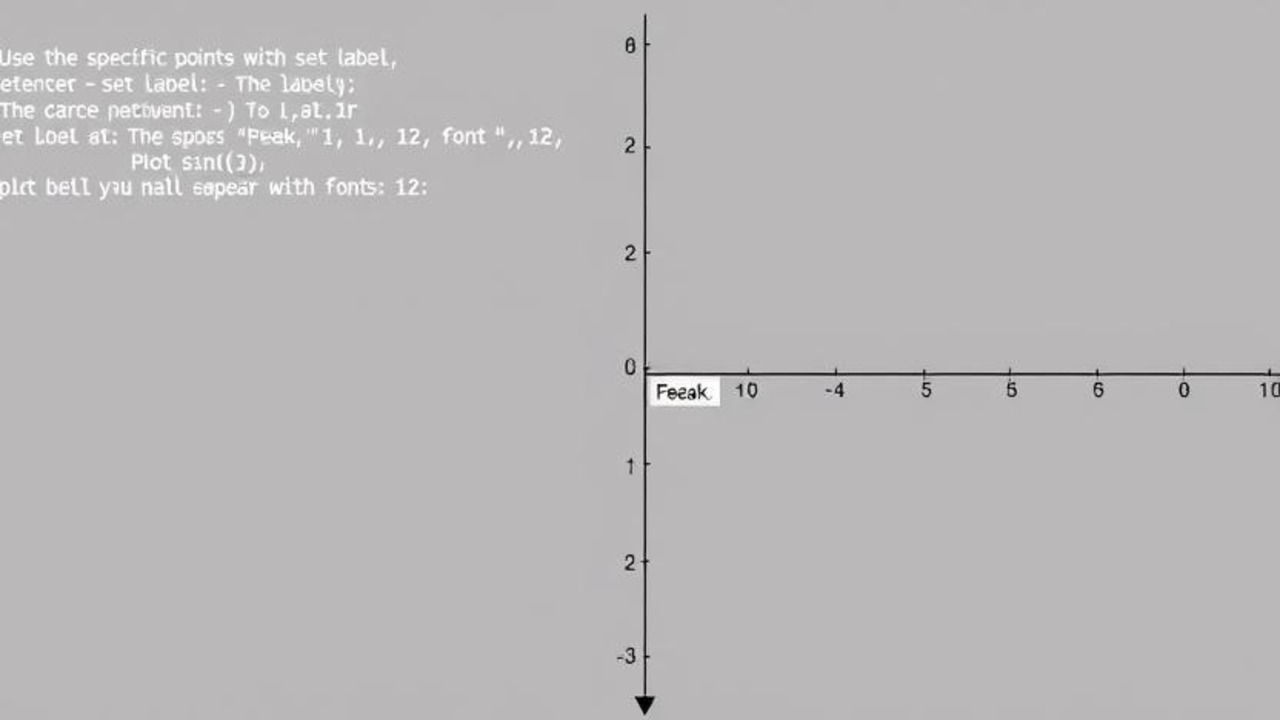
Use the set label command to add annotations within the plot. This command allows you to specify font size and screen coordinates:
gnuplot set label “Peak” at 1, 1 font “,12” plot sin(x)
The label “Peak” will appear at the specified coordinates (1,1) with font size 12.
Step 7: Customizing Font Size In Multiplots

Gnuplot allows you to display multiple graphs on one canvas in multiplot mode. Each plot within the multiplot can have distinct font sizes:
gnuplot set multiplot layout 2,1 title “Multiplot Example” font “,15” plot sin(x) title “Sine” font “,10” plot cos(x) title “Cosine” font “,10” unset multiplot
This setup generates a multiplot with two subplots, each with unique font sizes for titles and labels.
Step 8: Styling The Plot With Line Types And Colors
Using line styles and different colors for plot lines helps distinguish data points and complements font customization. To apply styles and colours, use set style commands:
gnuplot set style line 1 lt 1 lc rgb “blue” lw 2 pt 5 font “,12” plot sin(x) with lines linestyle 1
This sets the plot line to blue with a specified font size of 12 for the label.
Step 9: Customizing Font Sizes In 3D Plots With Splot
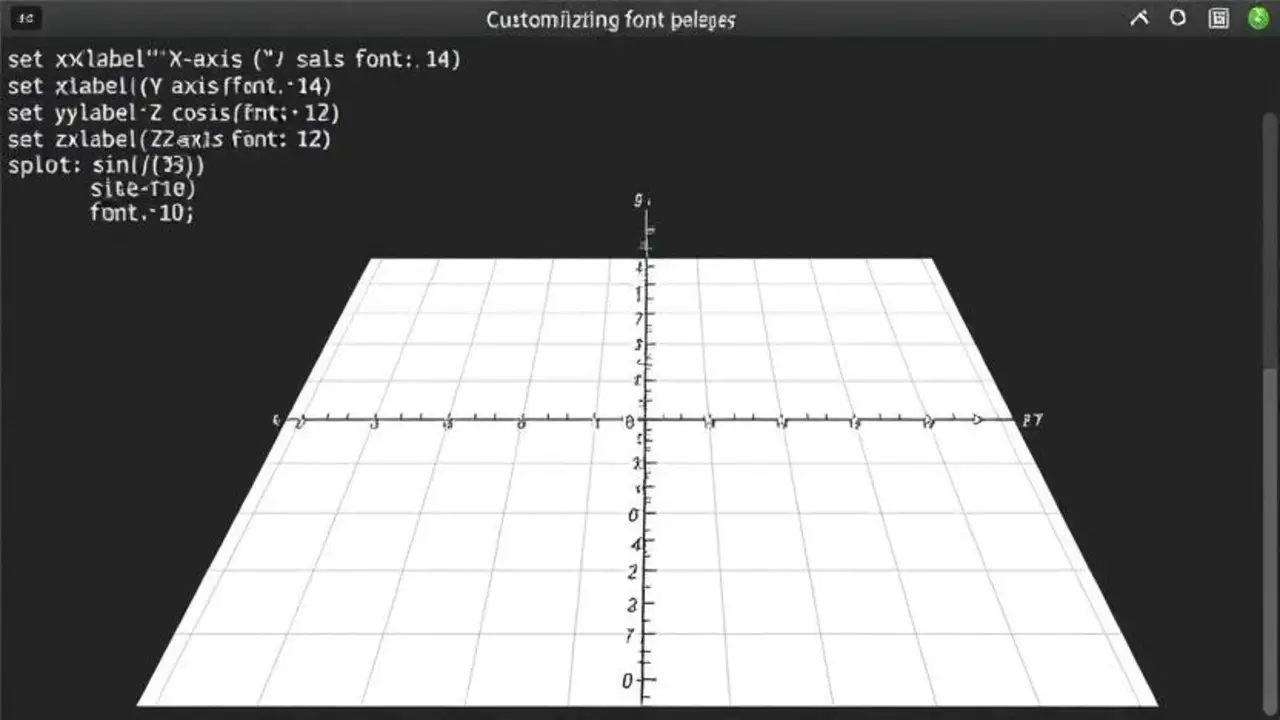
For 3D plots using the splot command, you can adjust axis labels for all three axes:
gnuplot set xlabel “X-axis” font “,14” set ylabel “Y-axis” font “,14” set zlabel “Z-axis” font “,12” splot sin(x)*cos(y) title “3D Plot” font “,10”
With this setup, the x, y, and z-axis labels are clearly visible with specified font sizes.
Step 10: Using Font Options In Scatter Plots And Plot Error Bars
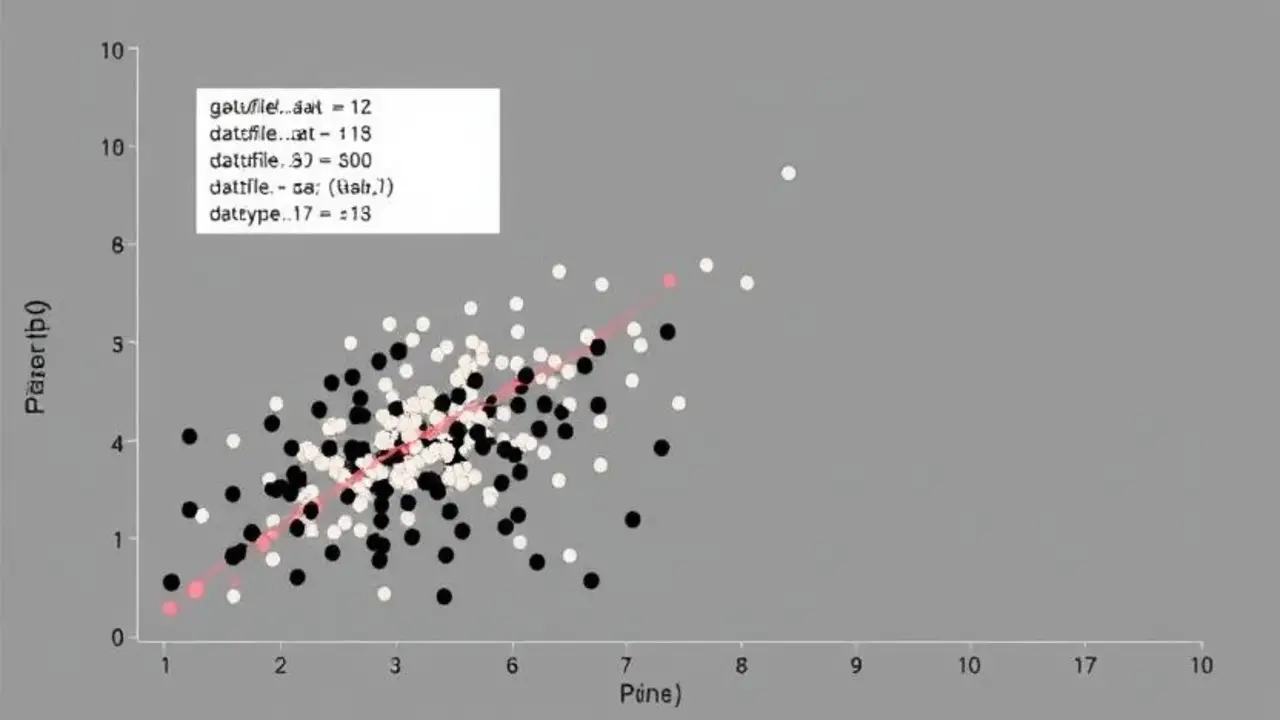
Scatter plots and plot error bars can also benefit from font customization. In scatter plots, fonts help highlight significant points:
gnuplot plot “datafile.dat” with points pointtype 7 font “,12”
In this example, the font size is set to 12 for labels on each scatter point, improving clarity in densely packed plots.
Advanced Tip: Using Symbol Fonts And LaTeX Commands
If you need to include special symbols in labels, you can use symbol fonts or embed LaTeX commands (with terminals supporting enhanced text mode):
gnuplot set title ‘{/Symbol a} Symbol Title’ font “,15” plot sin(x)
This command inserts a special symbol in the title.
Conclusion
Gnuplot offers extensive options for font customization, allowing you to fine-tune axis labels, titles, plot styles, and more. By experimenting with terminals, sizes, and font commands, you can create visually effective graphs tailored to your audience. Whether for on-screen display, print, or LaTeX integration, Gnuplot’s flexibility ensures your plots will be clear and professional.
FAQs
1.How Can I Set A Default Font Size For All Plot Elements?
Use set terminal with the font option, such as set terminal png font “Arial,14″, to apply a default size.
2.What Terminal Should I Use For Latex Integration?
The epslatex terminal is ideal for LaTeX integration, supporting embedded LaTeX commands and enhanced formatting.
3.Can I Apply Different Font Sizes To Each Axis In A 3D Plot?
Yes, use set xlabel, set ylabel, and set zlabel with the font option to adjust each axis label’s font size.
4.What’s The Best Way To Scale Fonts In A Multiplot?
Use the set multiplot layout command and assign font sizes individually to each plot for consistent scaling.
5.How Can I Add Symbol Fonts In Gnuplot?
Use {/Symbol text} within set title, set xlabel, etc., to incorporate symbols when using terminals that support enhanced text mode.

